Home
Categories
Dictionary
Glossary
Download
Project Details
Changes Log
What Links Here
FAQ
License
Perfo Logger scenario viewer
1 Interface
1.1 Menu
1.2 Actions on the events panel
1.3 Creating a sequence diagram
1.4 Sequence diagrams with network communication
2 Working with a sequence diagram
3 Notes
4 See also
1.1 Menu
1.2 Actions on the events panel
1.3 Creating a sequence diagram
1.4 Sequence diagrams with network communication
2 Working with a sequence diagram
3 Notes
4 See also
The perfo Logger scenario viewer allows to view the graph of a perfo Logger engine serialized scenario.

For each invocation to another framework instance through the network, the viewer shows:

For each notification, the viewer shows:

For each notification from another framework instance through the network, the viewer shows:

A popup window allows to filter what will be kept in the sequence:
After clicking on "Yes", a diagram appear showing the associated sequence diagram:
Interface
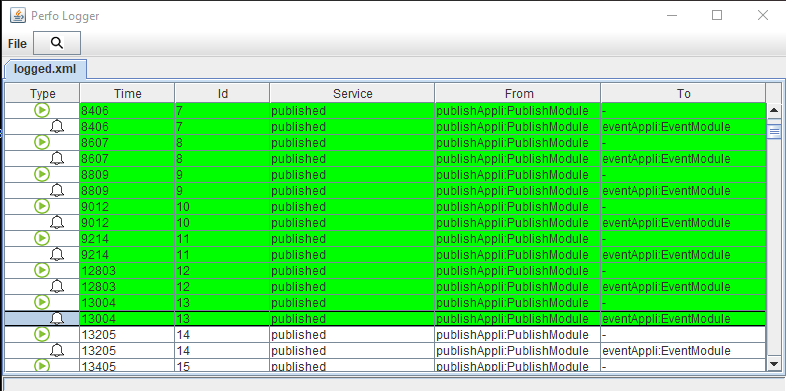
The viewer has:- A menu which allows to select the log file to show in the logger, or to save its content
- A panel which shows the events which were recorder in the log
- An
 icon showing that the event is an invocation
 - The time of the invocation (ie the time of the invocation as seen in output of the module which performed the invocation)
- An id for the invocation (this is a number which increments for each invocation)
- The service complete name (name and namespace if it has a namespace or only the name if the service has no namespace)
- The module which emitted this invocation
For each invocation to another framework instance through the network, the viewer shows:
- An
 icon showing that the event is an invocation
 - The time of the socket emission
- The service complete name (name and namespace if it has a namespace or only the name if the service has no namespace)
For each notification, the viewer shows:
- An
 icon showing that the event is a notification
 - The time of the notification (ie the time of the notification as seen in input of the module which was notified)
- The corresponding id of the invocation which is at the origin of this notification
- The service complete name (name and namespace if it has a namespace or only the name if the service has no namespace)
- The module which emitted the corresponding invocation
- The module which received the notification
For each notification from another framework instance through the network, the viewer shows:
- An
 icon showing that the event is a notification
 - The time of the socket reception
- The service complete name (name and namespace if it has a namespace or only the name if the service has no namespace)
Menu
A Search button allows to search events in the log, possibly filtered by their service or module:
Actions on the events panel
Right clicking on a row will shows an invocation will present the following menu:
- "Select Time From": Select the time beginning by this event
- "Select Time To": Select the time ending with this event[1]
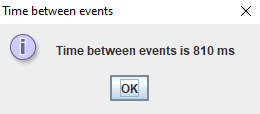
Only available after selecting "Select Time From" before. A popup window appear showing the time between the two selected time events. For example:
- "Select Sequence From": Select the sequence beginning by this event
- "Select Sequence To": Select the sequence ending with this event[2]
Only available after selecting "Select Sequence From" before
- "Select All Sequence": Select the whole sequence of events
- "Select Time From": Select the time beginning by this event
- "Select Time To": Select the time ending with this event[1]
Only available after selecting "Select Time From" before. A popup windows appear showing the time between the two selected time events
- "Select Sequence From": Select the sequence beginning by this event
- "Select Sequence To": Select the sequence ending with this event[2]
Only available after selecting "Select Sequence From" before
- "Select All Sequence": Select the whole sequence of events
Creating a sequence diagram
After having performed "Select Sequence To" or "Select All Sequence", the corresponding events are highlighted in green:
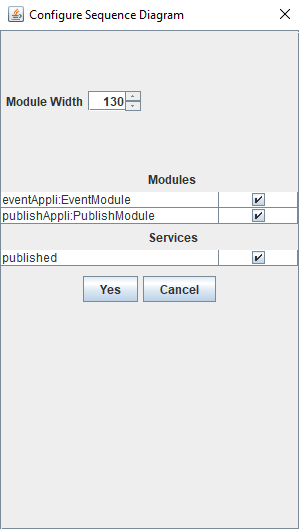
A popup window allows to filter what will be kept in the sequence:
- It is possible to filter which services will be shown in the diagram
- It is possible to filter which modules will be shown in the diagram
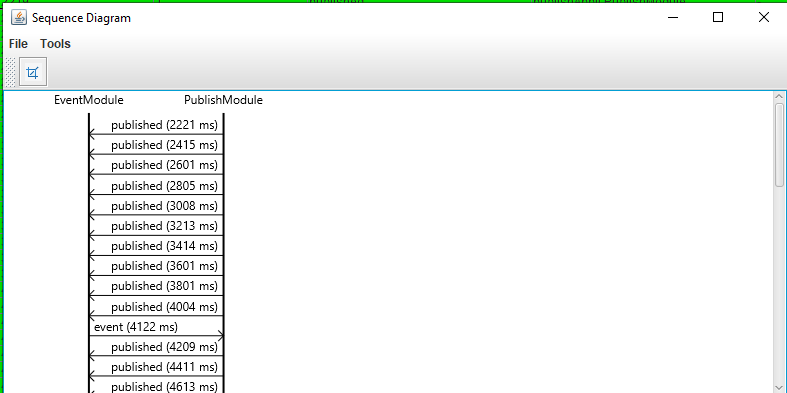
After clicking on "Yes", a diagram appear showing the associated sequence diagram:
Sequence diagrams with network communication
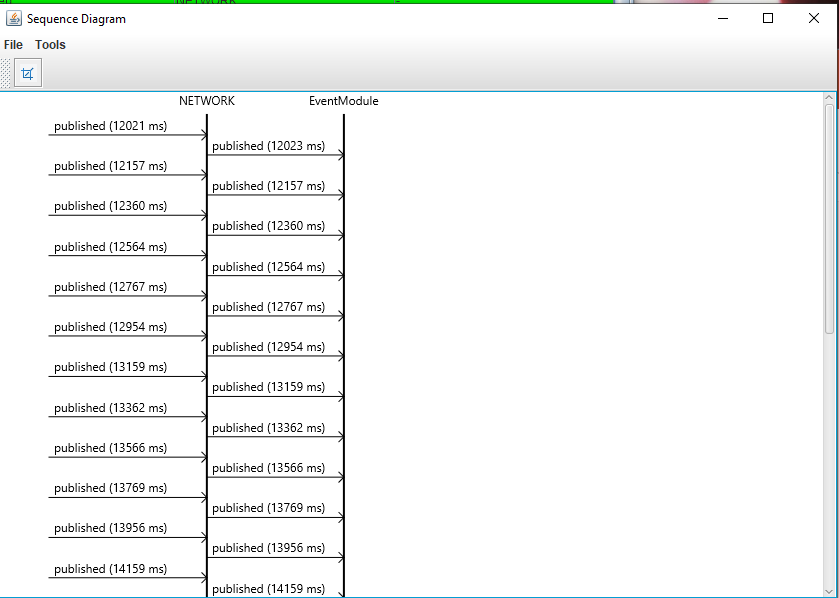
Invocations and notifications to and from another framework instance through the network are also shown in the sequance diagrams:
Working with a sequence diagram
The sequence diagram can be saved in png or svg. It can also be cropped to show a part of the sequence. Validating the crop will synchronize the logger view to the cropped diagram.Notes
See also
- Perfo Logger engine: The perfo Logger is an implementation of the recorder engine interface
×
![]()
Categories: builtin-applis